Review
A short book that focuses entirely on the calculation of (and importance of) CAC (Customer Acquisition Cost) and LTV (Lifetime Value). This is a super simple introduction to the two most important growth metrics.
If you can’t define or calculate CAC or LTV then this is a great place to start.
Key Takeaways
The 20% that gave me 80% of the value.
- Sustainable growth requires an understanding of unit economics, customer acquisition costs and lifetime value.
- Acquisition Cost Ratio = Lifetime Value (LTV) : Customer Acquisition Cost (CAC)
- CAC is incurred up front (leading) and LTV only happens over time (lagging). We understand CAC before we understand LTV – which can cause problems.
- An Ideal customer, as defined by Steve Blank in 4 steps to the Epiphany:
- Has a problem (that you can solve)
- Knows they have that problem
- Is looking for a solution
- Has hacked a solution to the problem already
- Can get budget to solve the problem
- The vast mass of humanity does not have a problem that a specific business solves
- CAC metrics include:
- Cost to react, conversion rate, cycle time, payback period etc..
- Unhelpful CAC = total marketing spend per period / number of new customers in period
- 3 reasons this is unhelpful
- People that didn’t convert in that period but are going to convert later are not included
- It doesn’t tell us which marketing activities led to new customers
- Doesn’t give us insight into what we can approve
- 3 reasons this is unhelpful
- CAC = cost to get a potential customer “in the door” / conversion rate to becoming a customer
- Where possible break out CAC separately for each channel. This provides more insight into what channels currently work and which we might need to tweak or abandon.
- Facebook Ads = $1.50 per click / 3% conversion rate = $50 (40% of acquisitions)
- LinkedIn Ads = $2 per click / 5% conversion rate = $40 (25% of acquisitions)
- Social Media Post = $0 per post / 6% conversion rate = $0 (35% of acquisitions)
- Double down too hard on a marketing channel and you can saturate it – only customers who are less likely to convert will be left – driving up your CAC
- A conversion funnel is a representation of the way potential customers gain awareness of your product, how they then sign up, start to pay, generate referrals, and more
| 100% (0% loss) | Acquisition | Getting someone on site |
| 70% (30% loss) | Activation | Sharing their email or signing up |
| 55% (21% loss) | Retention | Keeping people engaged for some time |
| 20% (64% loss) | Referral | They tell others |
| 5% (75% loss) | Revenue | They become paid customers |
- Scaling: when something increases in size but also becomes more efficient
- Scaling business are relatively rare. They often have network effects that make it easier for them to maintain customer acquisition and retention. They might also benefit from other advantages (e.g. funding, cash flow and market power advantages)
- Relying on paid acquisition can be dangerous. Treat customer retention and referrals as a priority
- Looking at single, static numbers for LTV, or for payback periods such as Months to Recover CAC, can produce misleading numbers.
- Make your customer acquisition model:
- Specific: by understanding difference by each channel
- Predictive: by understanding how costs and conversions change over time (if they scale)
- Fit with the business model
- Lifetime Value is a measure of contribution margin a business earns from selling to a customer over time.
- Unhelpful LTV calculation = Price of the product X Number of times the customer buys
- LTV = (Price – Cost to produce) X Number of times the customer buys
- Price per unit – Cost per unit gives us the Contribution Margin
- Do not simplify the formula. Showing the component parts of contribution margin is valuable
- A static measure of LTV is always going to be misleading. It’s more helpful to think of LTV as a flow of inputs and outputs. Chart it out over time
- Assumptions in this model:
- Customers start with a product’s limited free version, upgrade, and then are charged monthly while churning away.
- Churn is kept constant at an additional 5% a month and not compounded

- This shows when flows come in, when we breakeven, and what modifications could improve the situation. A single static LTV number doesn’t help as much.
LTV With Cohorts
- LTV by Cohort and CAC by channel
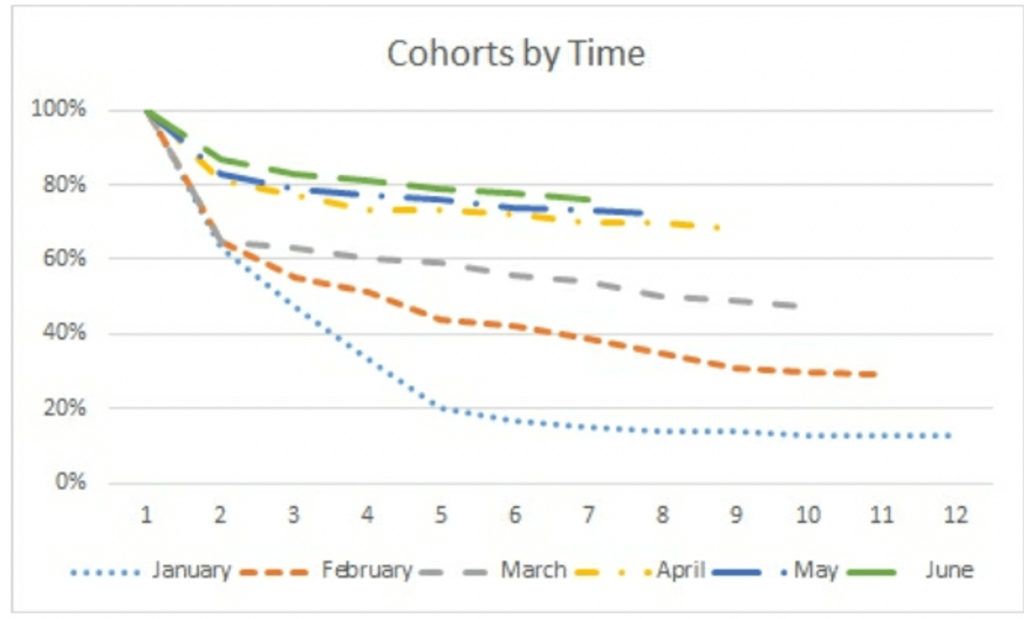
- Retention is an important part of LTV – it shows the loss of customers over time.

- Customers are shown by the month they joined – what % remain is shown in the following months
- It’s easier to see what’s going on if we shift everything left, so each cohorts relative month is shown in the same column

- And now shown on a graph – it’s even more clear how much retention has been improving.

- If you had distinct user types or customers (e.g. paid/free) – it might be worth duplicating the above tables for each type (to show different characteristics)
- Tracking LTV by cohort can also help you predict what revenue or gross profit flows to expect.
- Rule of thumb ratio for CAC : LTV of being 1 : 3 or 1 : 4
- Maintains a buffer between spending on customer acquisition. Allowing for all the other costs in your business and some risk to LTV too
- It also takes time to pay off the CAC. A higher ration allows for a longer payback period
- Slow down your investment in growth if your ratio drops too low
- Retention is a measure of how many customers or users stay.
- Churn is a measure of how many many customers or users leave.
- Retention = 1 – Churn
- Churn = 1 – Retention
- To calculate retention you need:
- To agree what you are measuring retention of
- e.g. member of a cohort
- e.g. customer of a certain product
- What qualifies as retained or churned.
- e.g. monthly product usage?
- e.g. repeat purchase frequency?
- e.g. not renew their annual payment?
- To agree what you are measuring retention of
Negative Churn
- If churn is just 1 – retention, can there be such a thing as negative churn?
- Churning away some bad customers can be good news
- LTV can increase (per channel or overall)
- Referrals can increase
- Improved efficiency (happy customers take less effort)
- Some churn can be good news
- Negative churn occurs when even after losing customers in a period the customers who remain end up spending more (perhaps by upgrading or buying more) and the business ends up with more revenue per customer than previously.
- It’s churn as measured on revenues or gross profit, not individual customers.
- Negative revenue churn is also known as positive net revenue retention